
 Twitter
 Slack
Slack GitHub
This document contains suggestions for debugging issues with your Contour installation.
Envoy container not listening on port 8080 or 8443
Contour does not configure Envoy to listen on a port unless there is traffic to be served. For example, if you have not configured any TLS ingress objects then Contour does not command Envoy to open port 8443 (443 in the service object). Because the HTTP and HTTPS listeners both use the same code, if you have no ingress objects deployed in your cluster, or if no ingress objects are permitted to talk on HTTP, then Envoy does not listen on port 8080 (80 in the service object).
To test whether Contour is correctly deployed you can deploy the kuard example service:
$ kubectl apply -f https://projectcontour.io/examples/kuard.yaml
Access the Envoy admin interface remotely
Getting access to the Envoy admin interface can be useful for diagnosing issues with routing or cluster health.
The Envoy admin interface is bound by default to http://127.0.0.1:9001.
To access it from your workstation use kubectl port-forward like so,
# Get one of the pods that matches the Envoy daemonset
ENVOY_POD=$(kubectl -n projectcontour get pod -l app=envoy -o name | head -1)
# Do the port forward to that pod
kubectl -n projectcontour port-forward $ENVOY_POD 9001
Then navigate to http://127.0.0.1:9001/ to access the admin interface for the Envoy container running on that pod.
Accessing Contour’s /debug/pprof service
Contour exposes the
net/http/pprofhandlers for go tool pprof and go tool trace by default on 127.0.0.1:6060.
This service is useful for profiling Contour.
To access it from your workstation use kubectl port-forward like so,
# Get one of the pods that matches the Contour deployment
CONTOUR_POD=$(kubectl -n projectcontour get pod -l app=contour -o name | head -1)
# Do the port forward to that pod
kubectl -n projectcontour port-forward $CONTOUR_POD 6060
Visualizing Contour’s internal directed acyclic graph (DAG)
Contour models its configuration using a DAG, which can be visualized through a debug endpoint that outputs the DAG in
DOT format.
To visualize the graph, you must have
graphviz installed on your system.
To download the graph and save it as a PNG:
# Port forward into the contour pod
CONTOUR_POD=$(kubectl -n projectcontour get pod -l app=contour -o name | head -1)
# Do the port forward to that pod
kubectl -n projectcontour port-forward $CONTOUR_POD 6060
# Download and store the DAG in png format
curl localhost:6060/debug/dag | dot -T png > contour-dag.png
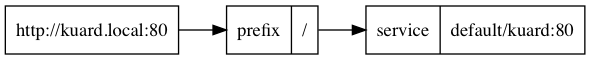
The following is an example of a DAG that maps http://kuard.local:80/ to the
kuard service in the default namespace:
Interrogate Contour’s gRPC API
Sometimes it’s helpful to be able to interrogate Contour to find out exactly the data it is sending to Envoy.
Contour ships with a contour cli subcommand which can be used for this purpose.
Because Contour secures its communications with Envoy using Secrets in the cluster, the easiest way is to run contour cli commands inside the pod.
Do this is via kubectl exec:
# Get one of the pods that matches the examples/daemonset
CONTOUR_POD=$(kubectl -n projectcontour get pod -l app=contour -o jsonpath='{.items[0].metadata.name}')
# Do the port forward to that pod
kubectl -n projectcontour exec $CONTOUR_POD -c contour -- contour cli lds --cafile=/ca/cacert.pem --cert-file=/certs/tls.crt --key-file=/certs/tls.key
Which will stream changes to the LDS api endpoint to your terminal.
Replace contour cli lds with contour cli rds for RDS, contour cli cds for CDS, and contour cli eds for EDS.
I’ve deployed on Minikube or kind and nothing seems to work
See [the deployment documentation][5] for some tips on using these two deployment options successfully.
[5]: {% link docs/main/deploy-options.md %}