
 Twitter
 Slack
Slack GitHub
Documentation
Introduction
Configuration
- HTTPProxy Fundamentals
- Virtual Hosts
- Inclusion and Delegation
- TLS Termination
- Upstream TLS
- Request Routing
- External Service Routing
- Request Rewriting
- CORS
- Websockets
- Upstream Health Checks
- Client Authorization
- TLS Delegation
- Rate Limiting
- Annotations Reference
- API Reference
Deployment
- Deployment Options
- Contour Configuration
- Upgrading Contour
- Enabling TLS between Envoy and Contour
- Redeploy Envoy
Guides
- AWS with NLB
- Cert-Manager
- External Authorization
- JSON logging
- Migrating to HTTPProxy
- Prometheus Metrics
- PROXY Protocol Support
- Resource Limits
Troubleshooting
- Envoy Administration Access
- Contour Debug Logging
- Envoy Debug Logging
- Visualize the Contour Graph
- Show Contour xDS Resources
- Profiling Contour
- Contour Operator
Resources
- Support Policy
- Compatibility Matrix
- Contour Deprecation Policy
- Release Process
- Frequently Asked Questions
- Tagging
Contribute
Visualizing Contour’s Internal Object Graph
Contour models its configuration using a directed acyclic graph (DAG) of internal objects.
This can be visualized through a debug endpoint that outputs the DAG in
DOT format.
To visualize the graph, you must have
graphviz installed on your system.
To download the graph and save it as a PNG:
# Port forward into the contour pod
$ CONTOUR_POD=$(kubectl -n projectcontour get pod -l app=contour -o name | head -1)
# Do the port forward to that pod
$ kubectl -n projectcontour port-forward $CONTOUR_POD 6060
# Download and store the DAG in png format
$ curl localhost:6060/debug/dag | dot -T png > contour-dag.png
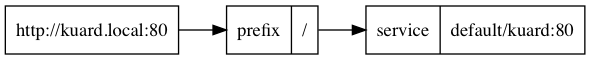
The following is an example of a DAG that maps http://kuard.local:80/ to the
kuard service in the default namespace:
 Edit
Edit